

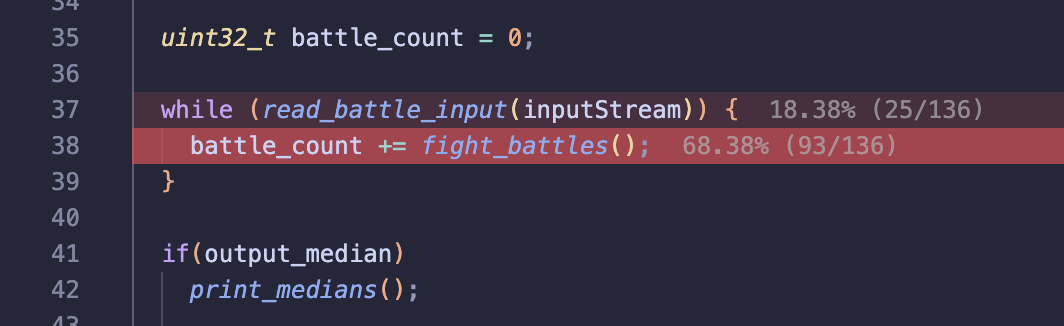
Perfanno-vscode is a simple extension that allows users to annotate buffers using perf output information. The result is a beatiful heatmap showing developers where performance bottlenecks are slowing down their program.
- Most of the processing algorithm is taken directly from https://github.com/t-troebst/perfanno.nvim. I am not the original author of the code. I ported it to vscode/typescript and added a few features.
- This extension is still in beta. It is not expansive in any way, but it does the job simply and effectively.
- Only C++ programs on MacOS (with perf on Ubuntu) have been tested. But anything that perf can profile should work.
- Please report any issues you may find.
- Generate profiling information:
perf record --call-graph dwarf ./my_program --some-arg < some_input_etcoptionally, use the following alias by adding it to your .bashrc or .zshrc:
alias perf_record="perf record --call-graph dwarf"and run:
perf_record ./my_program --some-arg < some_input_etc
Customization:
-eflag can be used to specify the event to profile. By default, it records cpu-cycles. Seeperf listfor a list of events.-Fflag can be used to specify the frequency of the event. For example,-F 1000will sample every 1000 events.- And many more. See
man perf-recordfor more information.
- Generate a report:
perf report -g folded,0,caller,srcline,branch,count --no-children --full-source-path --stdio -i perf.data > perf.outalias perf_report="perf report -g folded,0,caller,srcline,branch,count --no-children --full-source-path --stdio -i perf.data > perf.out"and run:
perf_report
This command will always be the same. Therefore, if desired, one can chain both commands like so:
perf_record ./my_program --some-arg < some_input_etc && perf_report
- (optional) If you are doing remote development and want to see the heatmap on your local machine, you can use
scpto copy theperf.outfile to your local machine. Then, runsed -i '' "s:{REMOTE_DIRECTORY}:{LOCAL_DIRECTORY}:g" "perf.out"to replace any instances of the remote directory with the local directory in the perf report.
- Open a source file in vscode and run the
perfanno.readFile(Perfanno: Read File) command using the command palette. Select theperf.outfile generated in the previous step. Success!
perfanno.readFile: Prompts for a file and annotates buffers with with the perf information.perfanno.pickEvent: Select a perf event to annotate.perfanno.clearHighlights: Clears all annotations and highlights.perfanno.highlight: Highlights the current line. Used to test certain highlighter capabilities.
perfanno.file: Perf datafile to search for by default. Will prompt with finder if file does not exist. Can be a file path.perfanno.eventOutputType: Specifies the output format for virtual text when annotating.perfanno.localRelative: Whether to show count relative to enclosing symbol (high sample count recommended).perfanno.highlightColor: The color of the highlight.perfanno.minimumThreshold: The minimum percentage threshold for annotating.perfanno.onlyLocalLeaf: Collapse each trace to its deepest in-workspace frame.